
Understanding the various technical charting patterns and having a trading plan for when these indications are visible are crucial for cryptocurrency investors.
For a lot of investors, trading cryptocurrencies simply entails purchasing and holding specific coins in the expectation that their value would rise over time. However, for some traders, trading cryptocurrencies entails analyzing the markets, examining price charts, and spotting telltale indicators that an asset may rise or collapse shortly.
Those warning indications are generally referred to as chart patterns, and they are distinguished by particular shapes that show up in an asset’s candlestick chart and typically hint at the upcoming volatility.
It’s still up for debate whether technical indicators are self-fulfilling prophecies or the product of mass-market psychology, but one thing is for sure: certain chart patterns frequently forecast shifts in the market. The death cross and the golden cross are two of those chart patterns that are most well-known.
What in cryptocurrency trading is a death cross?
A chart pattern called the death cross indicates that the price of an asset is beginning to weaken. It consists of two distinct lines referred to as “moving averages.”
The average price over a specific amount of time is calculated for each moving average line (MA), and then smoothed lines are created utilizing those points. For a five-day moving average, for instance, a line connecting the data points is created after calculating the average of each five-day subgroup.
The line will rise and fall depending on whether trading activity suddenly becomes bullish and more traders start buying an asset.
The 50-day MA and the 200-day MA are used in the death cross pattern. Because of the lines’ longer time horizons, short-term changes are less likely to alter them, making them more effective for determining long-term sentiment or the market’s prevailing mood.
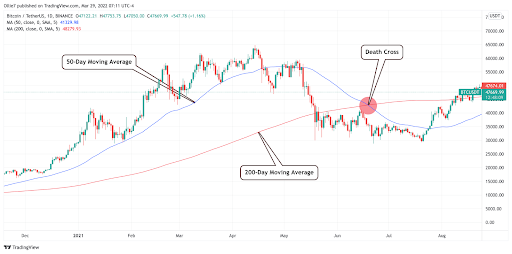
The 50-day MA is computed using a much shorter time frame than the 200-day MA, as the averages show. As a result, the 50-day average follows short-term price movements more closely than the 200-day average does. Accordingly, when the 50-day MA line crosses below the 200-day MA line, it signifies that short-term momentum is decreasing compared to the previous 200 days. The 50-day moving average (MA) crossing through the 200-day MA is referred to as the “death cross,” and it typically denotes a change in the mid- to long-term price trend.
Despite the gloomy overtones of a death cross, some traders frequently welcome it as a looming chance to purchase the asset at a reduced price. “Buy when there’s blood in the streets,” reportedly advised the late American financier Warren Buffett. Essentially, the phrase means to make a purchase while everyone else is making a sale.
How can a golden cross be identified?
When a shorter-term average price rises above a longer-term average price, a technical pattern known as the “golden cross” is formed. If an asset’s price has recently been supported by optimistic mood and the short-term price is higher than the long-term price, a breakout (a phenomena marked by upward momentum in an asset’s price) may have occurred before it.

A strategy can be developed around a trader’s interpretation of a golden cross, which is viewed as a positive indicator by traders. The 50-day and 200-day moving averages are the most frequently used averages when looking for golden crosses. Golden crosses are frequently detected by traders using shorter average price movements as well. The signal is stronger in terms of predicting upward price movement, nevertheless, the longer the averages utilized while looking for a golden cross.
Understanding these technical patterns and having the aptitude to predict what they might portend are crucial while navigating the world of cryptocurrency trading. The indicators provide insightful information about market mood and potential price moves regardless of your trading strategy. Understanding these tried-and-true patterns can be helpful for developing trading techniques or even for something as basic as choosing the right moment to purchase or sell an item.
Golden/death crosses: how trustworthy are they?
Golden and death crosses have both been observed to be trustworthy trading indications. It’s critical to comprehend your own unique investing objectives. These crosses may be a fantastic indicator for buying techniques if you are a long-term investor who prefers to hold assets. Crosses are indications that can be used to interpret buying and selling opportunities if you want to trade assets more actively, though it is advisable to employ other signals to support your trading.
